Home Affordability Index Overview
- Home Prices and Income are major factors in home affordability.
- The NAHB/Wells-Fargo HOI is one example of a home affordability index.
- During the housing bubble there were High Price to Income ratios.
An Overview of Home Affordability
Editor's Note: This is the first article of a two part series about measuring home affordability. This article includes an overview and an analysis of a national index. The second part will show how the index varies by region, and then offer some practical examples of home affordability.
Home Affordability: Overview and NAHB/Wells Fargo Home Opportunity Index
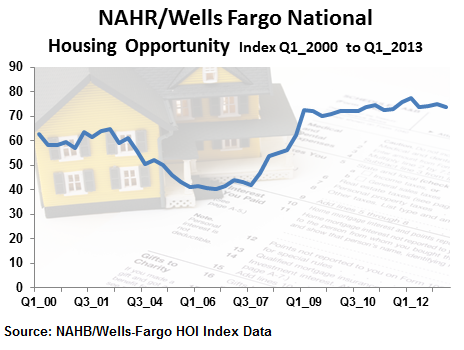
The NAHB/Wells Fargo Index tracks home affordability based on median home prices, median income, and mortgage interest rates. Their data includes a national index and regional based indices. The 1st Quarter 2013 index was 73.7, which according the NAHB press release means that:
"In all, 73.7 percent of new and existing homes sold between the beginning of January and end of March were affordable to families earning the U.S. median income of $64,400. This is down slightly from the 74.9 percent of homes sold that were affordable to median-income earners in the final quarter of 2012."
The National Home Affordability has been holding steady for the last couple of years.

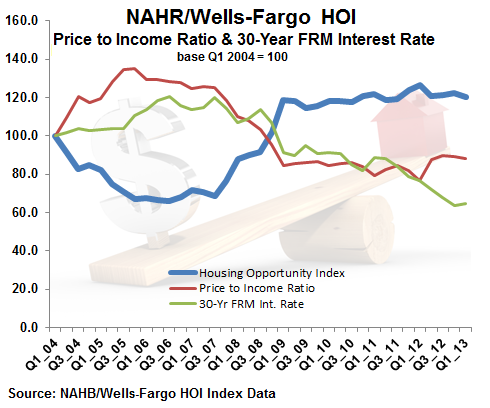
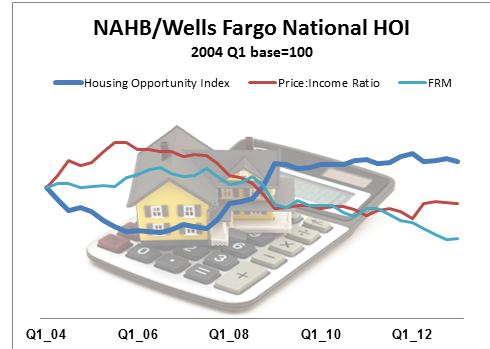
The following graph gives a clear picture of how home affordability is affected by housing prices and income. It uses the 2004 numbers as base numbers. The graph shows that as prices rose the Price-to-Income Ratio reached peak levels between 2005-2007. The interest rate also rose making mortgage loans more expensive and pushing home affordability out of reach. (More detailed information is presented below regarding each of the components).

One big lesson that all borrowers can learn is not to take on too much debt relative to their income. (If you are a borrower with weaker income, but large compensating factors such as a high down payment or large asset portfolio/high net worth, then work out your financial plan before taking a mortgage).
As the HOI index dropped between 2005-2007, the Price-to-Income Ratio increased. As the housing market bubbled, more and more borrowers took out mortgages that were unaffordable. The final result was a burst in the bubble and many borrowers were left with unmanageable loans.
The combination of lower home prices, lower interest rates and stricter loan requirements (including lower price-to-income ratios) have helped to create more affordable mortgages.
Tip
Check out mortgage rates and Get a mortgage quote from a Bills.com mortgage provider.
Mortgage Affordability: Price, Income, and Mortgage Rates
In order to get a better idea of how the mortgage and housing market has changed, here are four graphs that chart the median home price, median income level, 30-Yr. FRM Interest Rate and the Price-to-Income Ratio:
Tip
Once again, you can see that during the period of 2004-2007 income did not rise at the same pace as housing prices. The Price-to-Income ratio rose to very high levels. Interest rates for the 30-year FRM remained around 6%. One way some borrowers managed to take loans was through Adjustable Rate Mortgages (ARM), interest only payments, or other high cost loans - all of them carrying high risk.
Bills Action Plan
Before you buy a home and take a mortgage make sure that you understand your financial situation. Mortgage loans are long-term commitments. Here are some of the first steps to take:
- Learn about mortgage terms and mortgage rates.
- Prepare your budget.
- Know exactly how much you make and how much you spend each month.
- Control your debt level. Avoid making just minimum payments on your credit cards.
- Study the housing market.
- Save for a down payment and don’t overextend yourself.
